Quiz 1: Study Guide
Quizzes are open book. 30 minutes at the start of class.
Topics:
-
The processing coordinate system
-
Shapes: ellipse, line, rect, arc, bezier, curve, begin/endShape, triangle, quad
-
Colors: Grayscale, RGB, alpha
-
Shape options: fill, stroke, strokeWeight, noStroke, noFill
-
Useful functions:
println,background,size,random
Practice questions
-
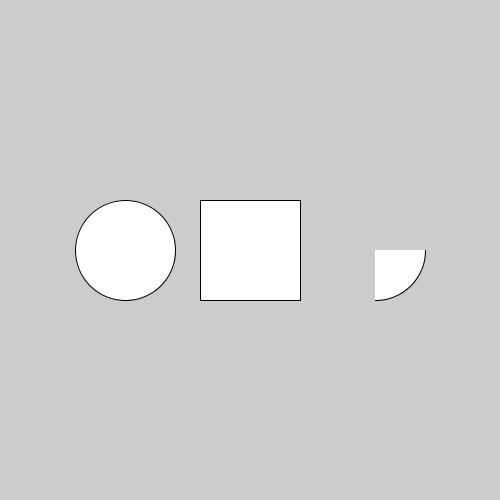
Write code to generate a circle, square, and pie slice of equal height and non-overlapping. For example,
-
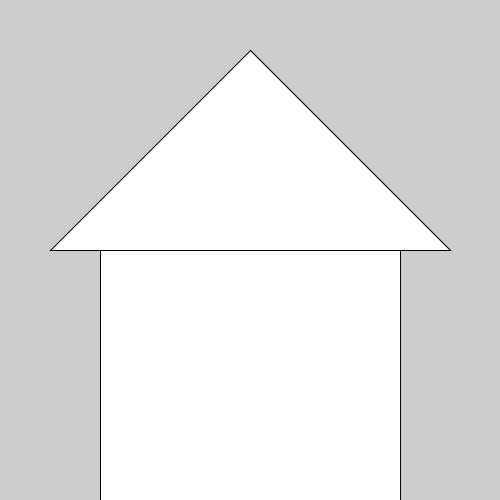
Write code to generate a rectangle with a triangle on top. The triangle’s base should be slightly larger than the rectangle. For example,
-
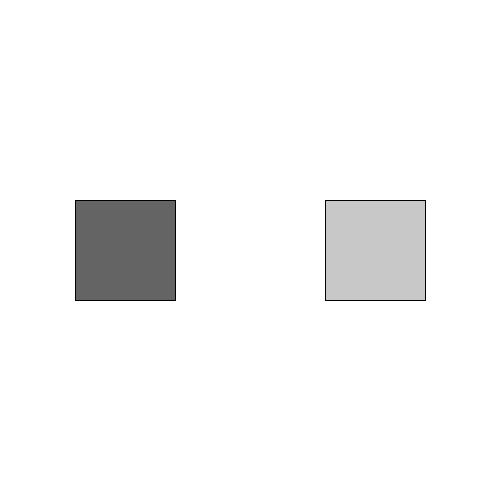
Consider the two squares in the following grayscale image. From what we know about color values, which square has a lower color value and which has a higher value?
-
Modify the following code to draw a red circle with transparency.
void setup() {
   size(500,500);
   background(255);
   ellipse(250,250,100,100);
}-
The following code has many syntax errors. Fix the code.
/*
CS110: Sample program
/*

void setup())
   size(500,500)
   ellipse(400, 40, 50 50); / draw circle
}-
When we run the following code, the screen is blank. Why?
void setup() {
  size(500,500);
  rectMode(CENTER);
  rect(250,250,600,600);
}-
The following code draws a triangle with points, X, Y, and Z. Implement the same program using beginShape and endShape.
void setup() {
   size(500,500);
   triangle(250, 50,   // p1
            100, 450,  // p2
            400, 450); // p3
}-
Modify the following code so that the shape is red and semi-transparent.
void setup() {
   size(500,500);
   triangle(250, 50,   // p1
            100, 450,  // p2
            400, 450); // p3
}-
How do we represent the color black using grayscale colors? Using RGB colors?
-
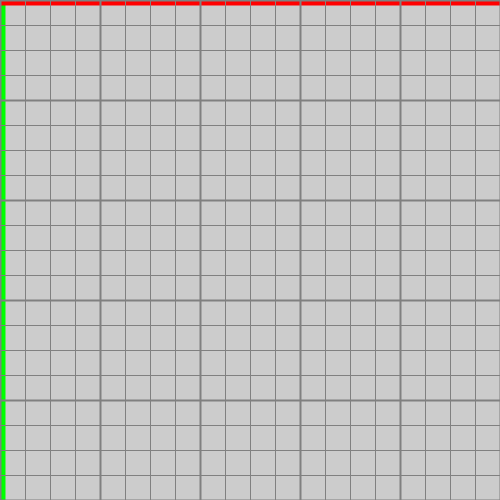
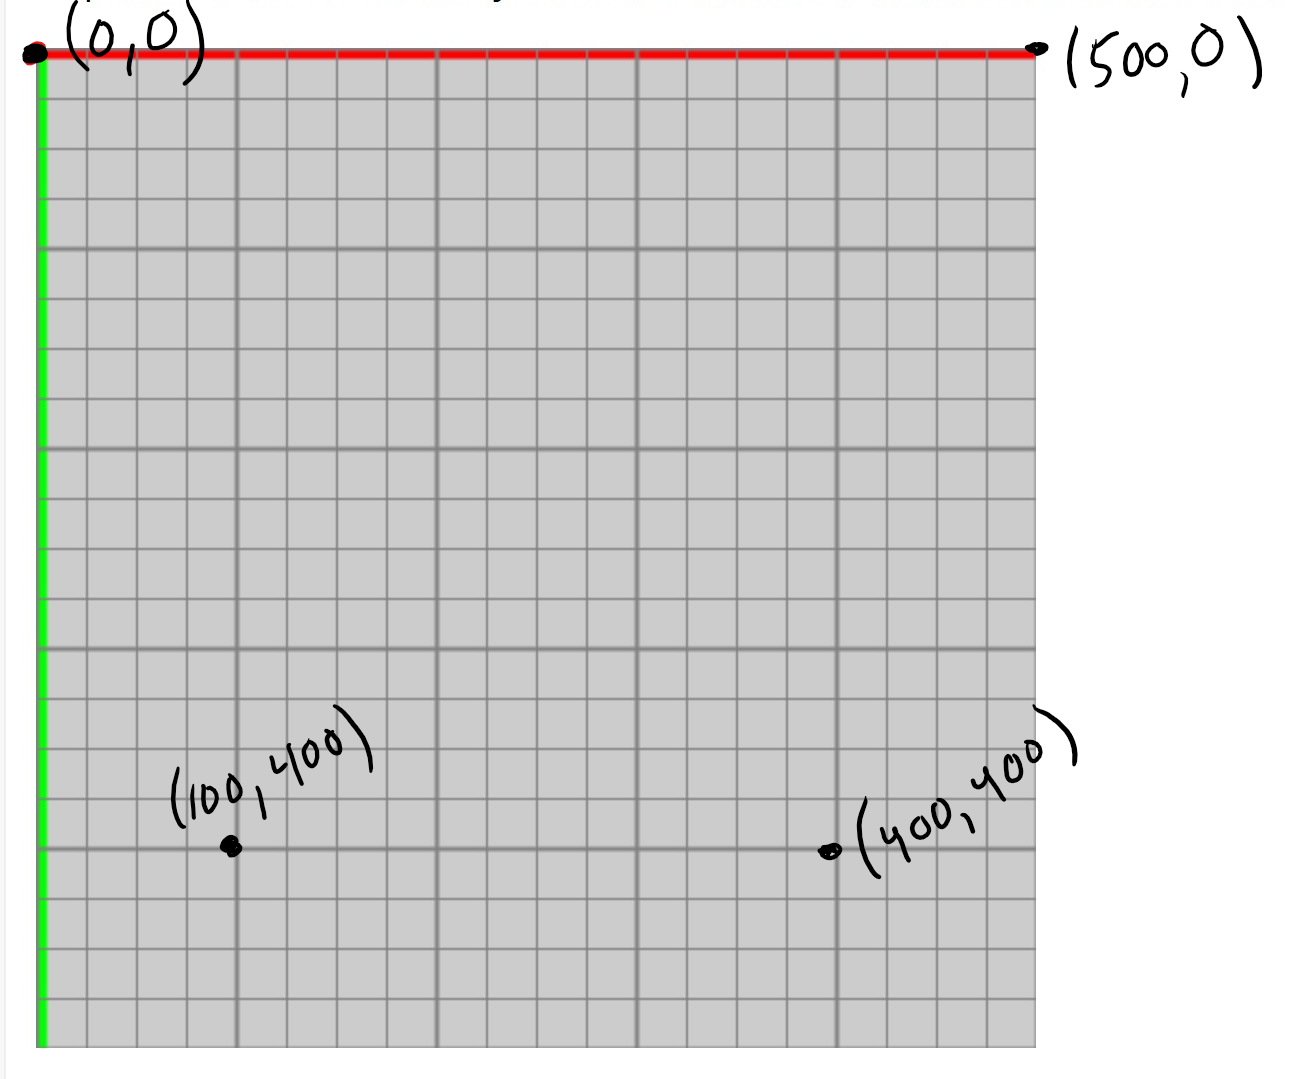
The coordinate system below extends from (0,0) to (500,500) and have axes matching the coordinate system in Processing. Thin lines correspond to increments of 25. Thick lines to 100. Draw the following points on the coordinate system below: (100,400), (0,0), (500,0), and (400,400)
-
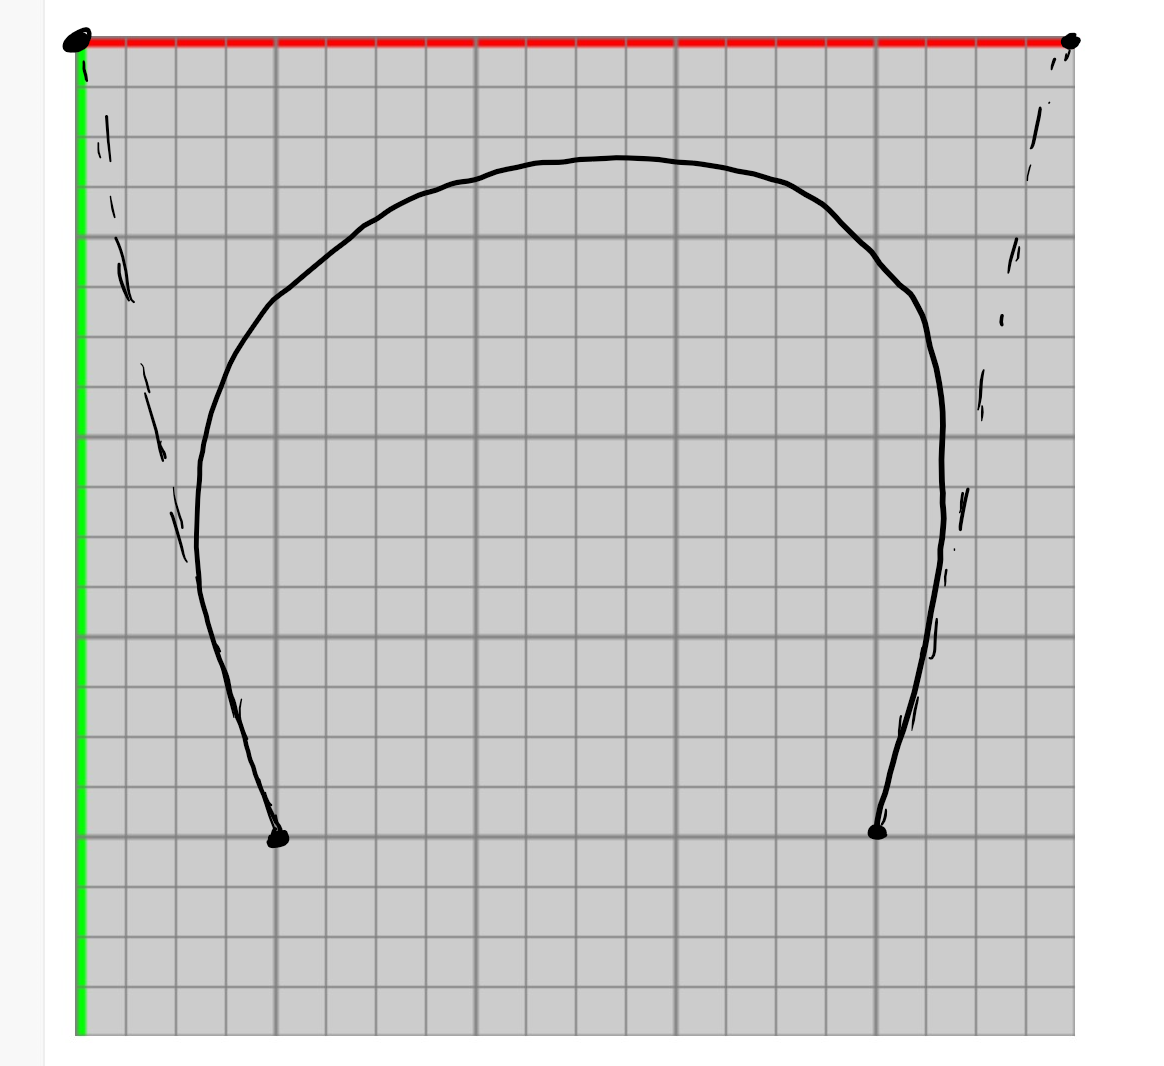
Consider the points above. Suppose we use these points to generate a bezier curve using the following function call:
bezier(100,400, 0,0, 500,0, 400, 400). Recall the first and last points are the endpoints of the curve and the middle two points are control points. Draw what the bezier curve will look like.
-
When drawing curves, what is the role of the control points?
Answers
void setup() {
  size(500, 500);

  rectMode(CENTER);
  ellipse(0.25*width, 0.5*height, 100, 100);
  rect(0.5*width, 0.5*height, 100, 100);
  arc(0.75*width, 0.5*height, 100, 100, 0, PI/2);
}
void setup() {
size(500,500);
triangle(0.5*width, 0.1*height, // top corner
0.1*width, 0.5*height, // left, bottom,
0.9*width, 0.5*height);// right, bottom
rectMode(CENTER);
rect(0.5*width, 0.75*height, 0.6*width, 0.5*height);
}-
The square on the left has the lower grayscale value because it is darker. The square on the right has a higher grayscale value because it is brighter.
void setup() {
   size(500,500);
   background(255);
   fill(255,0,0,128); // any 4th component value would be valid
   ellipse(250,250,100,100);
}
/*
CS110: Sample program
*/ // FIX: ending comment incorrect
void setup() { // FIX: Extra paren should be open brace
size(500,500); // FIX: missing semi-colon
ellipse(400, 40, 50, 50); // draw circle
// FIX: above, need comma after 3rd 50
// FIX: above, line comments need two forward slashes
}-
Because the dimensions of the rectangle are larger than the canvas, we don’t see the outline of the shape. The screen looks blank but we are seeing the interior of the rectangle.
void setup() {
   size(500,500);
   beginShape();
      vertex(250, 50);  // p1
      vertex(100, 450); // p2
      vertex(400, 450); // p3
   endShape(CLOSE);
}
// This questions is the same as the circle question!
void setup() {
size(500,500);
fill(255,0,0,128); // any 4th component value would be valid
triangle(250, 50, // p1
100, 450, // p2
400, 450); // p3
}-
The color black in grayscale is 0 and in RGB format as (0,0,0)
-
When drawing a bezier curve, the important thing is that the curve is inside the control points and the slope at the end points match the line connecting the endpoint to its control point.
-
The control points control the curvature. They are part of the drawn curve themselves.